LaTheta™ in-vivo Micro-CT scanners for small animals
|
LaTheta LCT-200™ Scanner
|

|
|
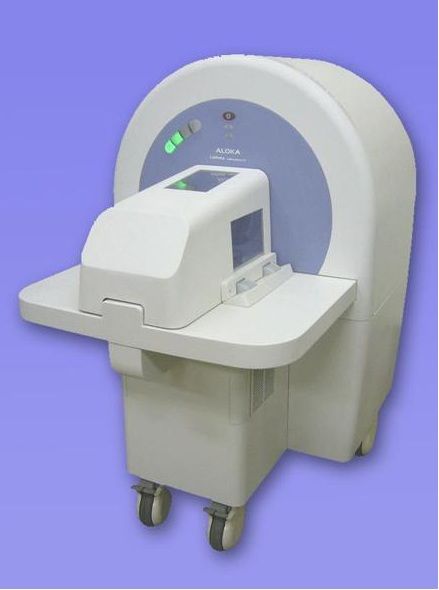
Designed for small animals and intended especially for the
in-vivo and ex-vivo animal research, the LaTheta™ CT scanner
possesses several distinctive features. For example, its extremely
sensitive detector allows working with low energy x-ray source, making
possible longitudinal studies. Very fast scanning and reconstruction
times of its detector allow seeing the result during the acquisition,
aborting, and changing the parameters, after the first slice is
displayed. In addition, high contrast and low noise level provide a
good resolution of tissues with similar density, such as visceral
organs.
Furthermore, LaTheta™ accommodates a wide range of
animals, thus allowing rats up to 1.5 kg to be scanned. Its
quantification of the scanned images implemented in the software
includes visceral, subcutaneous, and total fat volume, BMD, mechanical
strength and morphology with automatic cortical/trabecular bone
recognition, etc. The LaTheta software is very easy to operate and does
not require special training. Finally, LaTheta™ is compact and
portable. Combined with the very low outside radiation of
LaTheta™, these features allow using this instrument in any room.
LaTheta LCT-200 page on Hitachi Aloka Medical Ltd website
|
|
|
|
|
LaTheta™ application examples
|
|
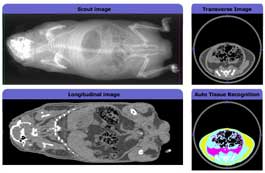
Images of a guinea pig taken by LaTheta™ |
 |
| Click on the picture for a larger image. |
Visceral versus subcutaneous fat measurement
One of the most commonly used analysis functions implemented
in the LaTheta software is an automated separation of adipose tissues
into visceral and subcutaneous parts. Built-in within the software
image processing algorithms perform recognition of the adipose tissue
types, which allows operating them as two separate entities. After
recognition, the software starts tissue parameters calculation yielding
values for size, CT-number, and standard deviation. The results
representation is similar to the fat ratio measurements where tissue
parameters are calculated for lean and adipose tissues; however, in
this case adipose part is divided into visceral and subcutaneous fats.
Fatty liver characterization
To diagnose a fatty liver, researchers need to measure the
liver fat content. One of the adopted procedures is to compare
CT-number of spleen, which is considered to be pure lean, with the
CT-number of liver. In most cases, liver fatness is homogeneous
throughout the whole liver, meaning that a single slice scan is
sufficient for the liver CT-number extraction. The LaTheta™
instrument allows performing scans containing multiple slices as well
as a single slice. Additionally, when measuring a single slice, the
radiation exposure is limited to the area of that slice. The liver is
diagnosed fatty if its CT-number is considerably lower than the spleen
CT-number. In lean animals, liver can contain up to 10% fat, while in
the obese ones, liver fatness can reach 30-40%.
Brown fat and white fat differentiation
In general, it is hard to distinguish between BAT (Brown
Adipose Tissue) and WAT (White Adipose Tissue) in the CT image due to
very high image noise on the CT scan images. Moreover, BAT and WAT have
very similar attenuation coefficients at standard operating energies
which leads to close CT-number values. Thanks to its advanced x-ray
detector, LaTheta™ can perform scans with extremely low image
noise so that these scans become suitable for BAT versus WAT automatic
recognition. After different fats have been recognized, the LaTheta
software calculates all tissue parameters separately.
|
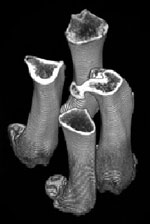
Scan of several isolated bones taken by LaTheta™
|

|
Bone measurements
The LaTheta™ scanner provides the capabilities of
various bone characterization analyses. Among them are Bone Mineral
Density (BMD), morphometry, mechanical strength, etc. The software
applies automatic bone type recognition between the cortical and
trabecular areas with the following calculation of the parameters. This
procedure makes bone measurements fast and easy task, especially when
researchers have to deal with hundreds of bones at a time.
Furthermore, multiple regions of interest can be analyzed
simultaneously. For example, in-vivo scan can be analyzed yielding the
parameters of several different bones at a time, or extirpated bones
can be measured faster if they are stacked in the same slice.
|